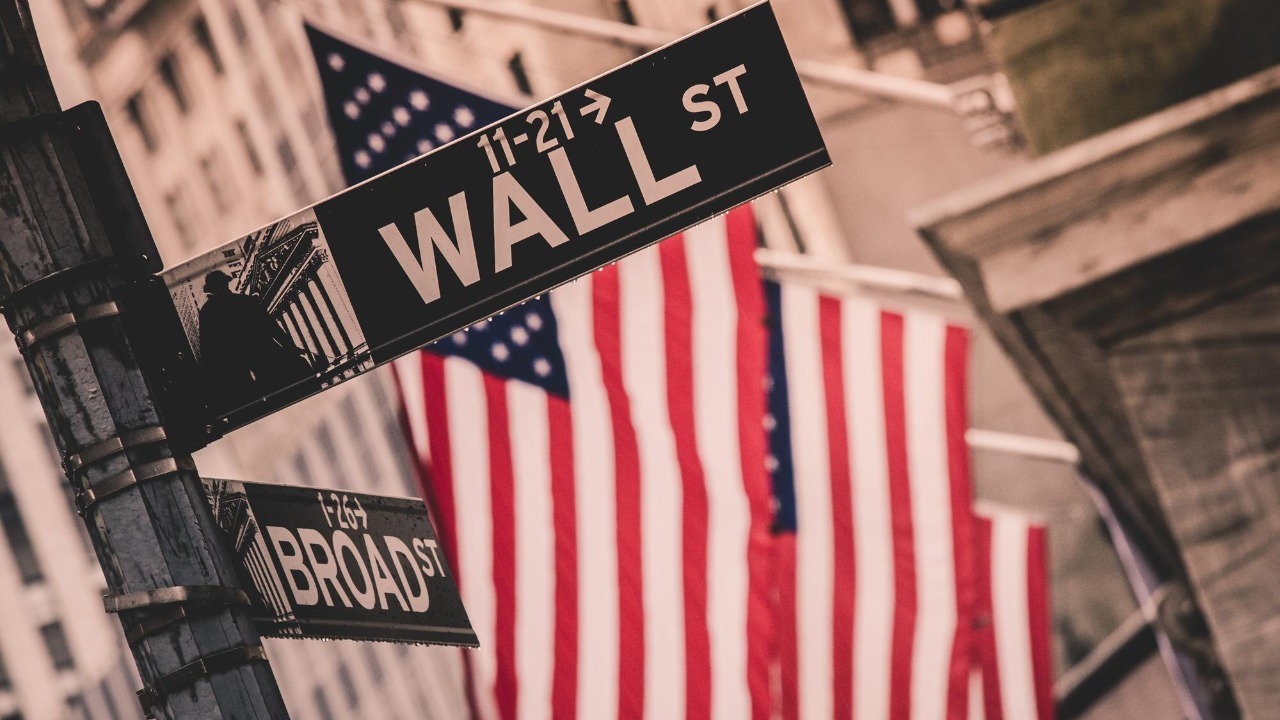
Wall Street is bracing for a familiar kind of pain. After a strong first year of Donald Trump’s return to the White House, strategists are warning that the classic midterm election slump in stocks is reasserting itself in 2026, with volatility already picking up and expectations coalescing around a sharp pullback before voters head to the polls. The pattern does not guarantee a crash, but the weight of history and current positioning suggests investors should be preparing for a rougher ride in the months ahead.
I see three forces converging: a long record of weak second-year returns, a specific history of midterm drawdowns in the S&P 500, and a market that has run hard on optimism about profits and artificial intelligence. Together they are reviving the “brutal midterm” script, even as many forecasters still expect the year to end higher than it began.
Why midterm years are historically the market’s soft spot
Presidential midterms have long been the awkward middle chapter of the four-year market cycle. Over the past 60 years, data show that stocks tend to underperform in the run-up to these elections as investors grapple with policy uncertainty and the risk that the president’s agenda will be blocked or diluted. The sitting president’s party has lost seats in the House in most of those contests, and markets typically price in that gridlock well before ballots are cast.
That political backdrop matters because it shapes expectations for taxes, regulation and spending, all of which feed directly into earnings forecasts and valuations. Research on prior cycles shows that stocks often struggle in the months before midterms, then find their footing once the composition of Congress is known and investors can recalibrate around a clearer policy path. That pattern is exactly what many strategists expect to see replayed in 2026, with the early-year wobble framed as the price of political clarity later.
The midterm drawdown pattern that has Wall Street on edge
Beyond the broad four-year cycle, the statistics for midterm years themselves are stark. Historically, the S&P 500 has “usually performs poorly” in these years, with one analysis finding that the index declines by an average of about 18 percent at some point before the election, even when the calendar year ultimately finishes in positive territory. Another breakdown of midterm performance shows that the S&P 500 has returned only about 1 percent on average during midterm years, while suffering an average drop of roughly 7 percent in the six months leading up to Election Day.
Strategists leaning on this history argue that 2026 is unlikely to be an exception. Research highlighted in Jan notes that the S&P 500 has suffered an average intra-year decline of 18 percent in past midterm cycles, and that volatility tends to be “heaviest” in the months just before the vote. That is the “brutal” pattern traders have in mind when they talk about the midterm script returning this year, and it is already shaping how portfolios are being positioned for the rest of the cycle.
2026: A familiar slump collides with an AI-fueled rally
The twist this time is that the market is entering the midterm window from a position of unusual strength. The S&P 500 has already gained about 16 percent in President Trump’s first year back in office, a performance that stacks up well against other second terms and leaves valuations stretched in some of the market’s hottest corners. That rally has been powered in part by enthusiasm for artificial intelligence, with tech giants such as Meta Platforms, whose chief executive Mark Zuckerberg is making an “almighty bet on AI,” helping to lift sentiment across global equities as investors, Buoyed by strong profits, head into 2026 full of optimism.
That optimism is reflected in formal forecasts. A survey of bottom-up analyst targets compiled earlier shows a median projection that the S&P 500 could reach about 7,560 within 12 months, implying roughly 10 percent upside from recent levels. At the same time, a separate review of strategist outlooks finds that Most experts expect another year of gains in 2026, But they also warn that the “risks are growing” and that volatility could remain elevated as the political calendar heats up. In other words, the consensus is for a choppy climb, not a smooth melt-up.
What the midterm script implies for the S&P 500 this year
When I line up those historical averages against today’s starting point, the message is clear: Wall Street expects a sizable air pocket before any year-end gains materialize. Analysts who have studied prior cycles say the S&P 500 has suffered an average intra-year decline of 18 percent in midterm years, and that volatility “may be heaviest” in the months just before the vote. Another set of Key Points underlines that pattern, noting that while the index often finishes higher by December, the path there is rarely smooth and tends to punish investors who chase rallies late in the cycle.
At the same time, the range of possible outcomes is wide. Indeed, the S&P 500 has done quite well in some midterm years, with returns ranging from up 38% to down 30 percent depending on the cycle. A parallel analysis shared through Indeed the S&P 500 underscores that same spread of outcomes, reminding investors that while the average midterm year is muted, individual years can be spectacularly good or painfully bad. That variability is exactly why many professionals caution against trying to time the midterm bottom too precisely.
How investors are positioning for a rough midterm while still betting on gains
Faced with this mix of bullish year-end targets and bearish midyear history, many investors are trying to thread the needle. Some are leaning into quality stocks and sectors that can better withstand policy shocks, while others are using options or tactical cash buffers to ride out the expected turbulence. One widely circulated forecast notes that the S&P 500 has returned only about 1 percent on average in midterm years, but that the index has historically rallied strongly in the six months after the vote, a pattern that encourages patient investors to stay invested rather than panic out at the first sign of trouble.
Retail traders are hearing a similar message from market educators. One popular webinar host, discussing past performance, highlighted that the S and P five hundred 18 percent and the star performer that matched that 100 posted a 22 percent return for the year, before adding, “Now the million dollar question is whether 2026 is going to be a positive year.” Professional strategists are more restrained in their language, but the core view is similar: history argues for a sizable pullback tied to the Midterm election, yet the fundamental backdrop of solid earnings, AI-driven investment and a still-supportive policy mix leaves room for the S&P 500 to finish the year higher.
More From The Daily Overview

Elias Broderick specializes in residential and commercial real estate, with a focus on market cycles, property fundamentals, and investment strategy. His writing translates complex housing and development trends into clear insights for both new and experienced investors. At The Daily Overview, Elias explores how real estate fits into long-term wealth planning.

