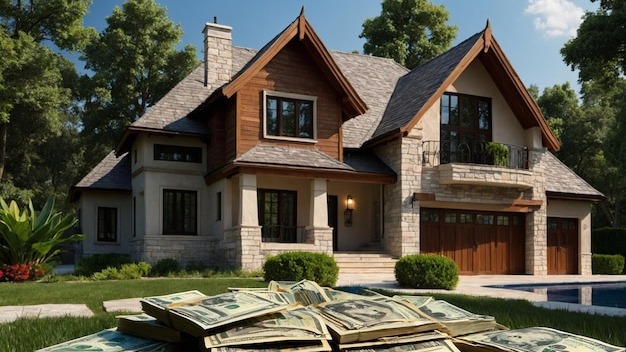
The income bar for homeownership in the United States has lurched upward in just a few years, turning what used to be a middle class milestone into a six‑figure test. To comfortably afford a typical home at a median price of $410,800, buyers now need roughly $50,000 more in annual income than they did in 2019, a shift that is reshaping where people live and how they think about the so‑called American dream. The core story is not only about high prices, but about a structural mismatch between wages, mortgage costs and housing supply that incremental rate cuts alone will not fix.
Behind the headline numbers is a quiet reordering of the country’s housing map. High‑cost coastal markets increasingly function like exclusive clubs for households earning well into six figures, while smaller metros in the Rust Belt and interior are emerging as affordability refuges. The question now is whether modest improvements forecast for 2026 will meaningfully close the gap, or simply slow the pace at which younger and middle income Americans are priced out.
The new math of a “typical” home
The starting point is the price tag. According to the Federal Reserve Bank of St. Louis, the median home now costs $410,800, a level that reflects years of rapid appreciation layered on top of pandemic‑era bidding wars. That figure alone does not capture the full burden on buyers, because closing costs, insurance and maintenance all scale with price, but it sets the baseline for what counts as a “typical” purchase in national statistics. When I compare that to pre‑2020 norms, it is clear that the market has reset around a much higher rung on the ladder.
On the income side, a widely cited estimate pegs the annual earnings needed to afford that typical home at $116,986, a number that effectively defines who gets to participate in today’s ownership market. One analysis of those requirements found that most American households now devote over 44% of their income just to cover payments on a median‑priced property, a share that far exceeds the traditional 30% affordability rule of thumb and signals how stretched budgets have become for buyers who do manage to qualify. That is the context in which the roughly $50,000 increase in required income since 2019 should be understood: not as a marginal squeeze, but as a fundamental change in who can buy.
How far incomes would have to jump
To restore the affordability conditions of 2019, the numbers suggest a dramatic adjustment would be needed on both wages and borrowing costs. One detailed scenario models Household incomes rising 56% to a median of $132,171, up from $84,763 today, alongside Mortgage rates falling to 2.65%, down from 6.15% as of early 2026. That combination would roughly recreate the payment‑to‑income ratios buyers faced before the pandemic run‑up, which shows just how far the market has drifted from its recent past.
In practical terms, that means the typical family would need to add nearly $50,000 to its annual earnings to stand in the same relative position it held six years ago, a leap that is unrealistic in the short term for anyone outside the top of the labor market. The same conclusion surfaces in more informal venues, where Incomes are described as needing to rise by $50,000 for Housing costs on median‑priced homes to feel manageable again, echoing the formal modeling with lived frustration. When I line up these figures against wage growth data, the gap looks less like a temporary imbalance and more like a structural affordability deficit that will take years of slower price growth to close.
Mortgage rates, “small wins” and the limits of relief
Interest rates are the other crucial variable in this equation, and here there is at least some relief on the horizon. Current data show 30‑year fixed mortgages averaging 5.95% and 20‑year loans at 5.99%, according to the latest figures compiled by Here and Zillow, a notable improvement from the 6.15% level used in recent affordability models. Forecasts for 2026 point to further easing as inflation cools, which would lower monthly payments for new buyers even if home prices do not fall outright.
Market watchers expect those rate moves to translate into what some describe as a “small‑wins year” for affordability, with According and Zillow projecting that 49 of the 50 largest U.S. metros will see costs ease and 20 will meet a key benchmark where payments consume no more than 30% of the median household income. Parallel projections from Home Sales To Remain in Low Gear and Balance Holds argue that price growth will slow enough to let buyer incomes catch up, while Housing Market Set for a and Comeback from NAR Predicts that Steady job gains and lower borrowing costs will fuel a modest rebound in sales. I read these outlooks as genuine progress, but they are incremental rather than transformative, especially when set against the 56% income jump that would be needed to fully rewind the clock.
Six‑figure thresholds and a fractured map
National averages also hide a stark geographic split. A recent survey of state‑level affordability found that Buying a typical home now requires a six‑figure salary in most states, with Bankrate identifying wide gaps between local incomes and the earnings needed to qualify. In the most extreme cases, Washington households must bring in more than $240,000 to afford a standard property in Washington, D.C., while Haw and other high‑cost states cluster not far behind, underscoring how ownership in those markets has become a luxury good.
Drilling down to metro areas, a comprehensive analysis of 2025 data found that According and Redfin and Census estimates show the median income required to buy in the top 50 cities exceeds the actual median income by more than 30%, a shortfall that effectively locks out typical earners from the urban cores where many jobs are concentrated. At the same time, a separate ranking of affordable cities highlights that a Rust Belt metro leads the list, with Located in the heart of the Rust Belt, Johnstown, Pennsylvania, emerging as a place where buyers can keep housing costs near 30% of gross income. That divergence supports a pattern I hear repeatedly from younger professionals: if you cannot raise your income to meet the market, you move to a market that fits your income.
Rust Belt refuges and the migration reset
The rise of places like Johnstown is not an accident, it is a response to the new math. In metros across the Rust Belt, decades of slow population growth left a stock of modestly priced homes that now look attractive to remote workers and families priced out of coastal hubs. The fact that Rust Belt and Johnstown can top affordability rankings while still offering access to regional job centers suggests a quiet rebalancing of where opportunity is found, especially for buyers who are willing to trade big city amenities for a lower cost base.
At the same time, the broader market is undergoing what Next and The Great Housing Reset describe as the beginning of a long, slow recovery, with expectations that the median U.S. sale price will rise more slowly than wages in coming years. If that pattern holds, I expect migration flows into affordable interior metros to accelerate, gradually revitalizing some local economies while relieving a bit of pressure on overheated coasts. The risk is that without parallel investments in infrastructure and zoning reform, these new destination cities could simply replay the same affordability crisis on a smaller stage a decade from now.
Down‑payment aid that targets six‑figure buyers
One of the more revealing shifts in policy responses is who down‑payment assistance is now designed to help. Programs that once focused on low income households are increasingly open to buyers earning well into six figures, a change driven by the reality that even solid middle class families struggle to save 20% of a $400,000‑plus purchase. In some metros, more than half of these initiatives now accept applicants with incomes above $100,000, a threshold that would have seemed out of place for “assistance” not long ago.
Concrete examples show how high the bar has moved. In Columbus, Ohio, a family of four making 80% of the area’s median income earns about $87,200, according to Jan and Columbus and Ohio and Housto, yet that still leaves them leaning on subsidies that can cover up to 5% of the home’s sale price. Separate guidance on How and Buying with a low income notes that in Washington, buyers may need at least $240,009 to qualify for typical homes, while households in more affordable states can get by with incomes closer to $64,179. When assistance programs are calibrated to those figures, it is a sign that the system is trying to patch over high prices rather than bring them down.
What $50,000 actually buys now
The $50,000 income gap that defines today’s affordability crisis is not just an abstract statistic, it shows up in the kinds of homes people can realistically buy. Detailed calculators that ask How much house can I afford on $50K explain that Buying on a $50,000 salary typically limits borrowers to modest starter homes or condos, even in relatively low cost regions, once taxes, insurance and other debts are factored in. For many would‑be buyers, that means stretching every other part of the budget or accepting a much longer commute to reach neighborhoods where prices align with their paychecks.
On the other end of the spectrum, a separate breakdown of Why the and Price Point Matters notes that a $400,000 home sits near the national median in many markets, yet the income needed to comfortably carry that mortgage is far above $50,000. That mismatch helps explain why Affording a typical U.S. home now requires 70% more income than it did six years ago, with Affording and related analysis putting the necessary earnings around $114,000 for a standard property. When I compare those figures to the $84,763 current median income cited in affordability models, the conclusion is hard to escape: the market has effectively redrawn the line between renters and owners along income levels that used to signal upper middle class status.
More From The Daily Overview
*This article was researched with the help of AI, with human editors creating the final content.

Elias Broderick specializes in residential and commercial real estate, with a focus on market cycles, property fundamentals, and investment strategy. His writing translates complex housing and development trends into clear insights for both new and experienced investors. At The Daily Overview, Elias explores how real estate fits into long-term wealth planning.

